Pearson’s correlation coefficient is the test that measures the statistical linear relationship or association between two variables.
Consider an example of a company with over 100 employees that wants to answer the following question:
Are employees with more years of experience more likely to get paid more?

We can see in the above scatter plot, as the years of experience increase, the employee’s salary increases.
So, we can say there is a positive correlation between years of experience and salary.
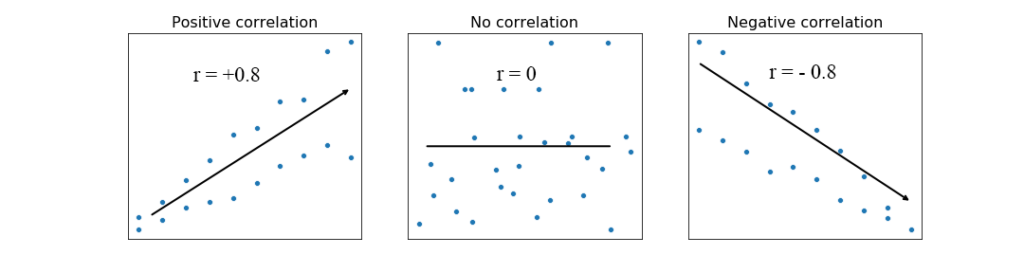
Values of Pearson’s correlation:
Pearson’s ‘r’ value ranges from -1 to +1.
– When r is greater than 0, there is a positive relationship between the two variables, that is when a variable increases the other variables increases too.
– When r is less than 0, we can say there is a negative relationship between the two variables where a decrease in the value of a variable increases the value of the another.
– Value of 0 indicates that there is no relationship between the variables.
The closer r value to +1 or -1 the stronger the linear relationship is.
Code:
Calculating Pearson’s r value can be easily done in python as follows:
from scipy.stats import pearsonr
pearson_r, p-value = pearsonr(experience_years, salary)
If the p-value is smaller than the significance level (α=0.05), we can conclude that the correlation is statistically significant.